
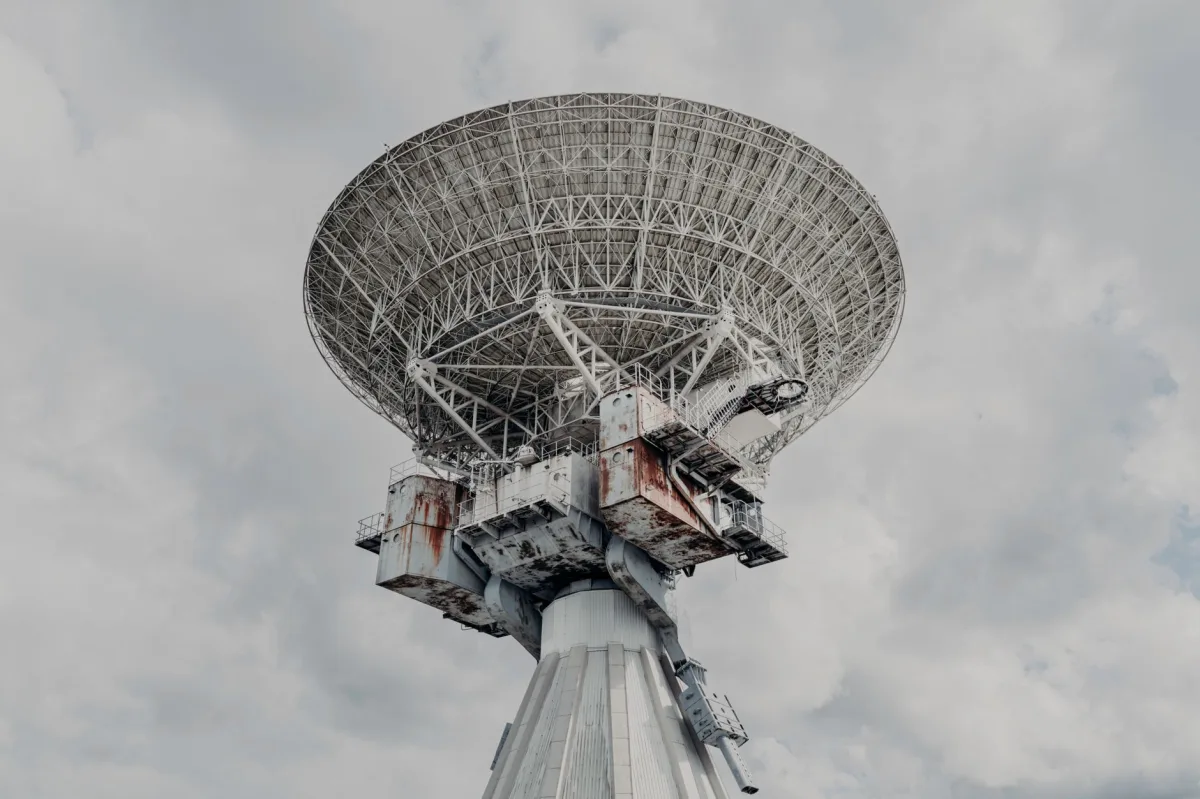
Weather satellites watch Earth from orbit, turning raw radiance into the forecasts we trust every day. In 2026 a blended network of geostationary and polar‑orbiting platforms delivers near‑real‑time temperature, wind, moisture and surface‑change data that powers everything from hurricane warnings to climate research. Below we break down the system—starting with the physics of the sensors, moving through the people who rely on the data, and ending with practical tips for getting the most out of satellite products.
What Are Weather Satellites? A Quick Primer
Weather satellites are space‑borne observatories equipped with instruments such as infrared imagers, microwave sounders and scatterometers. Their core purpose is to supply continuous, global observations that improve short‑term forecasts and long‑term climate monitoring.
Definition & Core Purpose
Definition: Weather satellites are space‑borne observatories that carry instruments such as infrared imagers, microwave sounders and scatterometers to measure atmospheric and surface variables. Their core purpose is to supply continuous, global observations that improve short‑term forecasts and long‑term climate monitoring.
Historical Milestones
- 1960 – TIROS‑1 transmits the first cloud pictures from orbit.
- 1975 – First GOES satellite provides continuous coverage over the United States.
- 1977 – Europe launches Meteosat, establishing the first geostationary system for the Eastern Hemisphere.
- 1990s – Polar‑orbiting POES and MetOp series add microwave sounding.
- 2010s – GOES‑R series and JPSS constellation boost resolution and latency.
- 2025 – NISAR (NASA‑ISRO) flies with dual L‑ and S‑band synthetic aperture radar, expanding surface‑change detection.
Key Players Today
In 2026 the operational fleet is a true partnership:
- NOAA runs the GOES and JPSS fleets for the United States.
- NASA builds research missions and collaborates on joint projects like NISAR.
- ESA and EUMETSAT operate the Meteosat and MetOp‑SG series for Europe.
- ISRO contributes the NISAR radar payload and launches on its GSLV‑F16 rocket.
- Commercial providers such as SpaceX, Arianespace and United Launch Alliance supply launch services, while companies like Spire and Tomorrow.io add small‑sat data streams.
Why Weather Satellites Matter in 2026
They are the backbone of modern meteorology, climate monitoring, disaster response and a host of economic sectors.
Climate Change Monitoring
Satellite‑derived temperature and humidity profiles are the backbone of climate‑trend analyses. Continuous infrared imaging tracks sea‑surface temperature anomalies that signal El Niño events, while microwave sounders detect subtle shifts in atmospheric moisture that influence long‑term precipitation patterns.
Disaster Preparedness
Real‑time lightning detectors and high‑frequency visible imagery on GOES‑East enable forecasters to issue tornado warnings within minutes of storm initiation. Polar‑orbiting microwave radiometers see through heavy rain to estimate flood‑producing precipitation, giving emergency managers precious lead time.
Economic Impact
Aviation relies on accurate wind profiles from scatterometers to plot fuel‑efficient routes. Agriculture benefits from satellite‑derived soil‑moisture maps that guide irrigation, while the energy sector uses cloud‑cover forecasts to predict solar‑farm output.
Policy & International Collaboration
The World Meteorological Organization coordinates data sharing among NOAA, ESA, JMA and other agencies, ensuring that a cyclone forming in the Indian Ocean can be tracked by both MetOp‑SG and GOES‑East, regardless of national boundaries.
Prerequisites for Understanding Satellite Data
Before diving into raw products, a few foundational concepts are essential.
Basic Meteorology Concepts
Familiarize yourself with temperature lapse rate, dew point and vorticity. These variables are what the raw radiance measurements are ultimately converted into.
Remote Sensing Fundamentals
All sensors detect electromagnetic radiation—visible, infrared, microwave—or emit their own signal as radar does. Understanding brightness temperature and backscatter is essential for interpreting the data streams.
Data Formats & Standards
Most operational products follow NetCDF or HDF5 standards. NOAA’s CLASS archive, NASA’s Worldview, and EUMETSAT’s Data Centre all provide APIs that return metadata‑rich files ready for ingestion into numerical weather prediction (NWP) models.
The Toolbox: Instruments That Drive Weather Observation
Each instrument type contributes a unique slice of the atmospheric picture.

Infrared & Visible Imagers
These cameras capture cloud tops and surface features. Infrared bands measure temperature, enabling night‑time storm tracking, while visible bands provide high‑resolution (up to 0.5 km) daytime imagery.
Scatterometers & Wind Sensors
By bouncing microwave pulses off the ocean surface, scatterometers infer wind speed and direction with an accuracy of ±2 m s⁻¹. NOAA’s Advanced Microwave Scanning Radiometer (AMSR) is a JAXA instrument, and ESA’s ASCAT is another widely used example.
Microwave Radiometers
Microwave sounders peer through clouds to retrieve temperature and humidity profiles at multiple atmospheric layers, a capability critical for initializing NWP models.
Radar Systems (L‑band, S‑band, Dual‑Radar)
The NISAR mission carries a 39‑foot antenna that simultaneously operates in L‑band (penetrates vegetation) and S‑band (high detail on foliage). This dual‑radar design can detect surface deformations smaller than half an inch, supporting both weather‑related flood mapping and solid‑Earth monitoring.
Orbital Architectures: Geostationary vs Polar‑Orbiting
Understanding the trade‑offs between orbit types helps you choose the right data for your application.
Geostationary GOES & Meteosat
Positioned 35,786 km above the equator, GOES‑East watches the Americas, delivering imagery every 5 minutes for severe‑weather “mesoscale” scans. Meteosat‑Third Generation serves Europe and Africa with a similar cadence.
Polar‑Orbiting JPSS & MetOp
Flying at ~800 km altitude, JPSS‑2 and MetOp‑SG A1 sweep the globe twice daily, providing high‑resolution (≤1 km) microwave and infrared data. Their global swath ensures no region is left unobserved.
Complementary Coverage
Geostationary platforms excel at real‑time monitoring of fast‑evolving storms, while polar orbiters deliver the detailed vertical sounding needed for medium‑range forecasts.
Launch Vehicles & Deployment
U.S. missions often ride United Launch Alliance Atlas V rockets, whereas ESA’s MetOp‑SG will launch aboard Ariane 6. NISAR lifted off on ISRO’s GSLV‑F16 from the Satish Dhawan Space Centre, showcasing the growing diversity of launch partners.
From Space to Surface: How Data Is Transformed
The journey from raw sensor counts to a forecaster’s screen involves several automated steps.
Telemetry & Downlink
Each satellite streams raw sensor counts to ground stations—NOAA’s network in the U.S., EUMETSAT’s in Europe, and ISRO’s in India. Latency for geostationary data is typically 5‑15 minutes; polar data can take up to 30 minutes because of larger data volumes.
Pre‑processing & Calibration
Raw radiances undergo radiometric and geometric correction, then are calibrated against onboard blackbodies and vicarious ground targets to ensure consistency across missions.
Assimilation into Forecast Models
Corrected observations feed into data‑assimilation systems like the NOAA GFS and ECMWF IFS. The process adjusts the model’s initial state, reducing forecast error and extending skillful prediction windows.
Public Access & APIs
Developers can pull near‑real‑time imagery via NOAA’s GOES‑R API, NASA’s Earthdata, or EUMETSAT’s Open Data Portal. Libraries such as Satpy and PyART simplify ingestion for Python‑based analysis.
Real‑World Tradeoffs: What Do Satellites Trade Off?
No single satellite can maximize every metric; designers must balance competing goals.
Spatial vs Temporal Resolution
Geostationary imagers sacrifice fine spatial detail for rapid refresh, while polar orbiters offer sharper images but only revisit a location twice per day.
Cost & Launch Frequency
A single GOES‑R class satellite costs upwards of $900 M, whereas a CubeSat constellation can deliver niche data for a fraction of the price, though with limited coverage.
Data Latency vs Accuracy
Faster downlink can mean less time for thorough calibration, potentially increasing measurement uncertainty. Operational centers balance these factors based on the intended use—nowcasting versus climate trend analysis.
Inter‑Agency Data Sharing
While NOAA openly shares GOES data, some high‑resolution SAR products from NISAR are initially restricted for scientific use before becoming public after a proprietary period.
Pros, Cons & Best Practices for Users
Advantages for Meteorologists
- Continuous monitoring enables rapid detection of severe weather.
- Multispectral data improves vertical profiling of temperature and moisture.
- Global coverage ensures no blind spots for model initialization.
Limitations for Smaller Agencies
High data volumes demand robust processing infrastructure. Smaller weather services may rely on regional data hubs or cloud‑based platforms to avoid costly hardware.
Optimizing Data Use
Combine geostationary rapid scans for nowcasting with polar‑orbiting soundings for model runs. Apply bias‑correction techniques to harmonize overlapping datasets.
Future Trends
On‑board AI processors will pre‑filter data, cutting latency for critical alerts. Small‑sat constellations will supplement traditional platforms, adding radio‑occultation and hyperspectral observations.
Common Mistakes & Troubleshooting Tips
Misinterpreting Infrared Temperature
Infrared channels show cloud‑top temperature, not surface temperature. A cold cloud top often signals a strong updraft, not a cold surface.
Ignoring Cloud‑Top Height Bias
Satellite algorithms can underestimate heights in thick convective cores; cross‑check with radar when possible.
Data Gaps & Redundancy
Plan for satellite outages by integrating data from multiple sources—e.g., using both GOES‑East and Meteosat‑Third Generation for overlapping regions.
Software Compatibility Issues
Ensure your processing pipeline supports NetCDF‑4 and HDF5; older tools may choke on newer metadata structures.
Who Should Use Weather Satellite Data? Persona Mapping
| Target Persona | Recommended Option | Key Reason & Real‑World Benefit |
|---|---|---|
| National Meteorological Service | Full GOES‑R + JPSS‑2 suite | Comprehensive real‑time and global sounding data for all forecast horizons. |
| Disaster Response Teams | Geostationary rapid‑scan imagery + NISAR SAR alerts | Immediate storm tracking and sub‑meter ground movement detection for flood and landslide warnings. |
| Climate Researchers | MetOp‑SG + NISAR long‑term archives | High‑resolution climate variables and surface‑change metrics spanning decades. |
| Agricultural Planning | Polar‑orbiting microwave moisture products + commercial CubeSat NDVI feeds | Accurate soil‑moisture maps and vegetation health indices for irrigation scheduling. |